


 --%3e%3csvg version='1.1' id='Layer_1' xmlns='http://www.w3.org/2000/svg' xmlns:xlink='http://www.w3.org/1999/xlink' x='0px' y='0px' viewBox='-295 387 20 20' style='enable-background:new -295 387 20 20;' xml:space='preserve' width='20' height='20'%3e%3cstyle type='text/css'%3e .st0%7bfill:%231B71DE;%7d %3c/style%3e%3ctitle%3eicon-files%3c/title%3e%3cpath d='M-285,387c-5.5,0-10,4.5-10,10s4.5,10,10,10s10-4.5,10-10S-279.5,387-285,387z M-285,405.4c-4.7,0-8.4-3.8-8.4-8.4 s3.7-8.4,8.4-8.4s8.4,3.8,8.4,8.4S-280.3,405.4-285,405.4z'/%3e%3cg%3e%3cpath class='st0' d='M-285,401l-3.7-2.2c-0.1-0.1-0.3-0.1-0.4,0l-0.8,0.5c-0.2,0.1-0.2,0.4-0.1,0.5c0,0,0.1,0.1,0.1,0.1l4.8,2.9 c0.1,0.1,0.3,0.1,0.4,0l4.8-2.9c0.2-0.1,0.2-0.4,0.1-0.5c0,0-0.1-0.1-0.1-0.1l-0.8-0.5c-0.1-0.1-0.3-0.1-0.4,0l-3.7,2.2 C-284.7,401.1-284.9,401.1-285,401z'/%3e%3cpath class='st0' d='M-282.3,397l-0.6,0.4l-1.7,1c-0.1,0.1-0.3,0.1-0.4,0l-1.7-1l-0.6-0.4l-1.3-0.8c-0.1-0.1-0.3-0.1-0.4,0 l-0.8,0.5c-0.2,0.1-0.2,0.4-0.1,0.5c0,0,0.1,0.1,0.1,0.1l1,0.6l0.6,0.4l3.2,1.9c0.1,0.1,0.3,0.1,0.4,0l3.2-1.9l0.6-0.4l1-0.6 c0.2-0.1,0.2-0.4,0.1-0.5c0,0-0.1-0.1-0.1-0.1l-0.8-0.5c-0.1-0.1-0.3-0.1-0.4,0L-282.3,397z'/%3e%3cpath class='st0' d='M-288.2,395.7l1.5,0.9l0.6,0.4l1,0.6c0.1,0.1,0.3,0.1,0.4,0l1-0.6l0.6-0.4l1.5-0.9l1.6-1 c0.2-0.1,0.2-0.4,0.1-0.5c0,0-0.1-0.1-0.1-0.1l-4.8-2.9c-0.1-0.1-0.3-0.1-0.4,0l-4.8,2.9c-0.2,0.1-0.2,0.4-0.1,0.5 c0,0,0.1,0.1,0.1,0.1L-288.2,395.7z'/%3e%3c/g%3e%3c/svg%3e)
In this article; we're going to install a Zabbix Agent to monitor a MySQL Server. If you're not familiar to Zabbix; i recommend you to read my another article about Zabbix Server installation. Here in this article i assume you have a running Zabbix Server on IP (888.888.888.888) and MySQL Server on IP (999.999.999.999)
Notes
- In fact; with this article; you'll read MySQL Server Status Variables from your
mysql> SHOW GLOBAL STATUS;output. As you know it's managed by MySQL Server itsself. The most important keys are; Bytes_received, Bytes_sent, Connections, Aborted_clients, the Com_xxx statements (How many inserts, updates, creates, etc. commands had made to MySQL Server?) etc. You can find your Server Variables depending on your MySQL Version from; MySQL Documentation. - If you want to monitor MySQL Server OS; Disk size, CPU Usage, Network Monitoring, etc. you also have to listen another outputs from Zabbix Agent please read my another post about; Ubuntu Monitoring on Zabbix 3.4.
Prerequisites
- Zabbix Server 3.4 or Above
- MySQL Server to be Monitored
Installing Zabbix Agent on MySQL Server
First of all we're going to install Zabbix Agent, these steps are depends on your OS. I assume you're using Ubuntu 18.04. If you have another OS, you can pick-up these steps from Zabbix download page they created a installation step tool that makes easy to access installation repos. You should only install the zabbix-agent; as i assume you have two diffent servers; Zabbix Server -which you already have- and Zabbix Agent. Here you can find the Zabbix Download tool.
$ wget https://repo.zabbix.com/zabbix/3.4/ubuntu/pool/main/z/zabbix-release/zabbix-release_3.4-1+bionic_all.deb
$ dpkg -i zabbix-release_3.4-1+bionic_all.deb
$ apt update
$ apt install zabbix-agent
Enable Zabbix Server Access to Zabbix Agent
After your installation completed. You have to give IP Based permission to your Zabbix Agent. Beside that; the default port for Zabbix Agent is 10050; and you have to open that port for Zabbix Server. When Zabbix Server needs your data; it should be able to read it from your Zabbix Agent.
Step1/2 - Zabbix Agent Configuration
Open your Zabbix Agent configuration with your favourite editor. Here we use nano. Nano is part of the standard Ubuntu installation, and should be on your system already. If for some reason it's not, use your favorite package manager to install nano.
$ sudo nano /etc/zabbix/zabbix_agentd.conf
When you open zabbix_agentd.conf file; you will find lots of configuration parameters, but in this article we only need to change two lines. Server and ServerActive parameters are the IP Addresses for Zabbix Server which will connect to your agent and read the data.
Server=IPorHOSTNAME
ServerActive=IPorHOSTNAME
$ sudo systemctl restart zabbix-agent.service
$ sudo systemctl enable zabbix-agent.service
Step 2/2 - Firewall Configuration
If you Did not enable your firewall i highly recommend you to enable Ubuntu Uncomplicated Firewall. The documentation can be found here. First enable the ufw;
$ sudo ufw enable
And open your 10050 port to Zabbix Server to access your data; enabling a port for all IPs may cause vulnability
$ sudo ufw allow from 888.888.888.888/24 to any port 10050
Creating a User for MySQL Server Monitoring
We have installed Zabbix Agent, create a solid connection layout and now we need a MySQL local user to read MySQL Server Status Variables. Here we're going to create a user named zabbix with password Password. You should/may change the password and user name. Connect MySQL as root;
$ mysql -u root -p
Create zabbix user, apply the privilages and close your connection as root.
mysql> GRANT USAGE ON *.* TO 'zabbix'@'localhost' IDENTIFIED BY 'Password';
mysql> FLUSH PRIVILEGES;
mysql> exit;
Configuring Agent for MySQL Monitoring
Now; these steps are also for making cross checks to our installation.
Step 1/4 - Configuration Files Include
Zabbix Agent configuration file has a variable named "Include". That means any files in that folder with extentioned ".conf" will be included as configuration file.
$ sudo nano /etc/zabbix/zabbix_agentd.conf
Now search line with Include; and if not exist define it with path of configuration files.
Include=/etc/zabbix/zabbix_agentd.d/*.conf
Step 2/4 - MySQL Configuration File
The default setup creates the userparameter_mysql.conf file under the configuration folder. Check if file /etc/zabbix/zabbix_agentd.d/userparameter_mysql.conf exists, if its not exist create the file userparameter_mysql.conf under /etc/zabbix/zabbix_agentd.d/ with these contents.
You may list the folder contents with;
$ ls -lah /etc/zabbix/zabbix_agentd.d/
If there isn't any configuration file, create userparameter_mysql.conf file and just copy and paste;
# For all the following commands HOME should be set to the directory that has .my.cnf file with password information.
# Flexible parameter to grab global variables. On the frontend side, use keys like mysql.status[Com_insert].
# Key syntax is mysql.status[variable].
UserParameter=mysql.status[*],echo "show global status where Variable_name='$1';" | HOME=/etc/zabbix mysql -N | awk '{print $$2}'
# Flexible parameter to determine database or table size. On the frontend side, use keys like mysql.size[zabbix,history,data].
# Key syntax is mysql.size[<database>,<table>,<type>].
# Database may be a database name or "all". Default is "all".
# Table may be a table name or "all". Default is "all".
# Type may be "data", "index", "free" or "both". Both is a sum of data and index. Default is "both".
# Database is mandatory if a table is specified. Type may be specified always.
# Returns value in bytes.
# 'sum' on data_length or index_length alone needed when we are getting this information for whole database instead of a single table
UserParameter=mysql.size[*],echo "select sum($(case "$3" in both|"") echo "data_length+index_length";; data|index) echo "$3_length";; free) echo "data_free";; esac)) from information_schema.tables$([[$
#Default below
UserParameter=mysql.ping,HOME=/etc/zabbix mysqladmin ping | grep -c alive
UserParameter=mysql.uptime,HOME=/etc/zabbix mysqladmin status | cut -f2 -d ":" | cut -f1 -d "T" | tr -d " "
UserParameter=mysql.threads,HOME=/etc/zabbix mysqladmin status | cut -f3 -d ":" | cut -f1 -d "Q" | tr -d " "
UserParameter=mysql.questions,HOME=/etc/zabbix mysqladmin status | cut -f4 -d ":"|cut -f1 -d "S" | tr -d " "
UserParameter=mysql.slowqueries,HOME=/etc/zabbix mysqladmin status | cut -f5 -d ":" | cut -f1 -d "O" | tr -d " "
UserParameter=mysql.qps,HOME=/etc/zabbix mysqladmin status | cut -f9 -d ":" | tr -d " "
UserParameter=mysql.version,mysql -V
Step 3/4 - MySQL Connection Configuration Folder
Create directory that is in HOME variable
$ sudo mkdir /var/lib/zabbix
Step 4/4 - MySQL Connection Configuration File
And create file /var/lib/zabbix/.my.cnf with configuration
[client]
user = zabbix
password = Password
Restarting Zabbix Agent
After cnfiguration files and connection layout you should restart Zabbix Agent to apply your settings you have to restart your Zabbix Agent service.
$ sudo service zabbix-agent restart
Configuring Zabbix Server
Now at the Zabbix Agent we're all set, it's time to set up Zabbix Server. These steps are; Creating Zabbix Host, Creating Zabbix Host's Data Template, Creating Graphs, Checking Latest Data that we're recieving and Monitoring Zabbix Agent - MySQL Server.
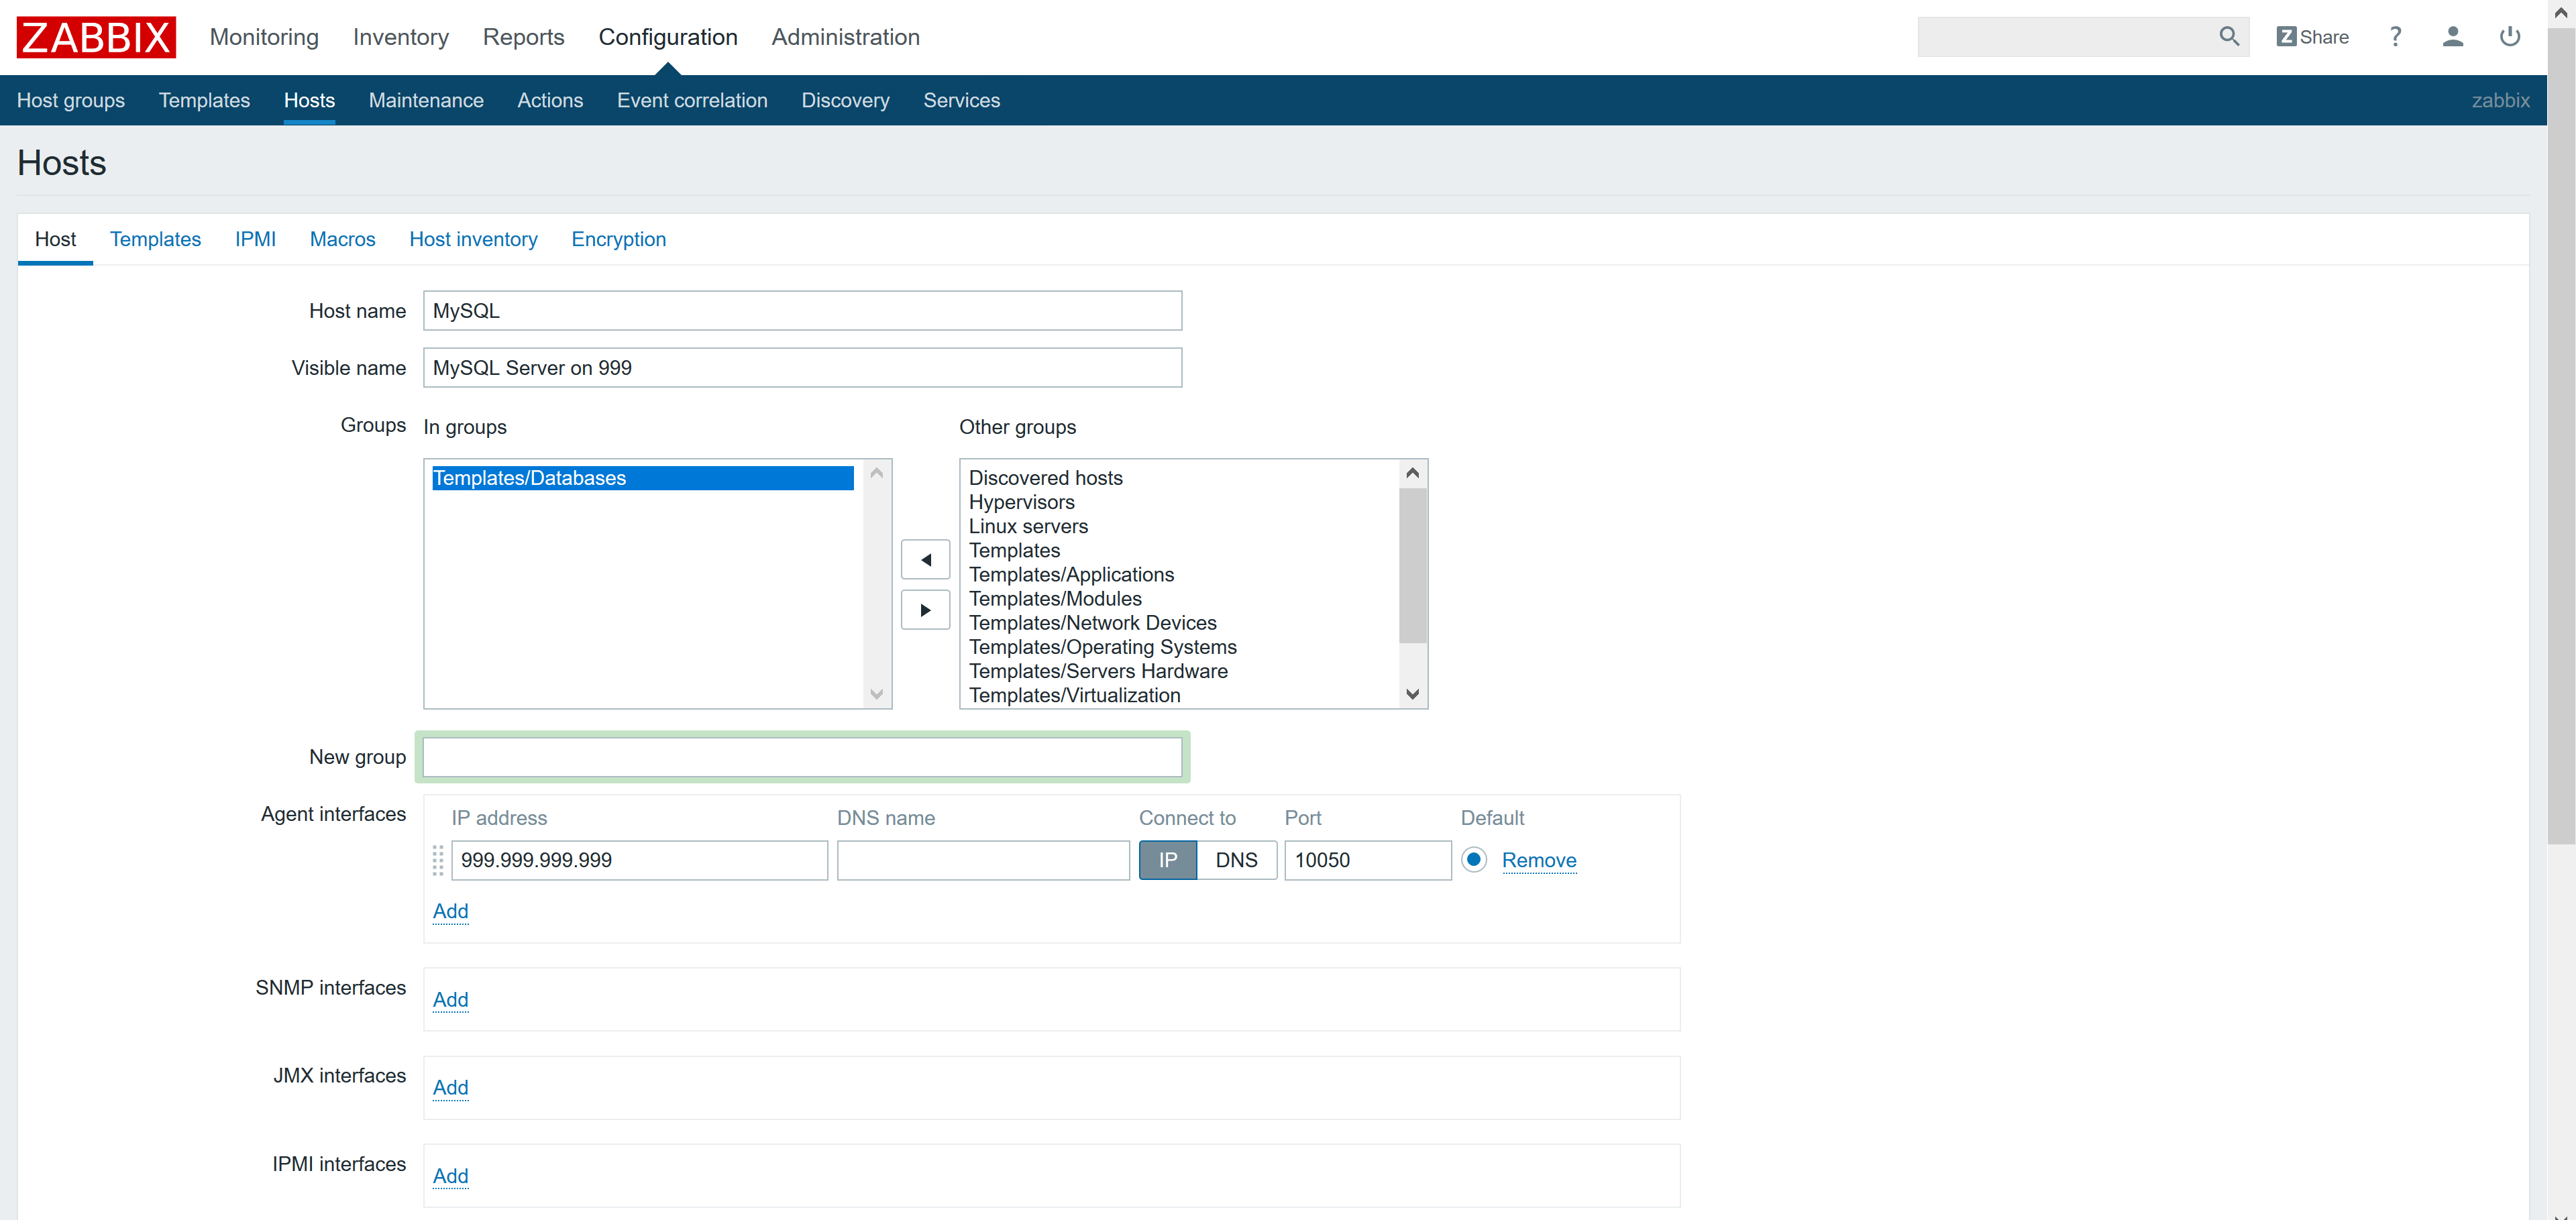
Step 1/5 - Creating Zabbix Host / Zabbix Agent Connection
Now go to your Zabbix Server web interface. Click on 'Configuration', 'Hosts' and 'Create host'. Enter 'Host name' of your MySQL server. You can check it in MySQL Server console
$ hostname
Select the needed group or Create a New Group and enter MySQL Server IP address in 'Agent interfaces'. Click 'Add' on the bottom of the page.
Now go to 'Hosts' and click on host 'Name', 'Templates' menu. Start typing 'mysql' in 'Link new templates' and select the 'Template App MySQL'. Press 'Add' and 'Update'. That's all. Now we can see MySQL bandwidth and MySQL operations in 'Monitoring' -> 'Graphs'.
Zabbix Client is configured now and you can check operations and bandwidth graphs through Zabbix Server web interface. You can also use this configuration to check MariaDB databases or add any other templates for monitoring the health of server or its services.


